
The Brazilian population totaled 205.5 million people in 2016 according to the projections of the IBGE National Household Sample Survey (PNADC). In that year, there were 105.9 million women and 99.6 million men, representing 51.5% and 48.5% of the Brazilian population, respectively. The Brazilian female population has its own characteristics and sometimes different from those presented by the male population. To trace a profile of Brazilian women, this chapter describes the characteristics of the Brazilian female population.
Spatial Distribution
Brazilian women lived, in the great majority, in the cities. Of the total 105.9 million women, 91.6 million (or 86.5%) lived in urban areas. The country's rural areas have housed a female population of 14.3 million, less than the male population of 15.6 million.
Graph 1.1
Distribution of the Brazilian population by gender, 2016

Source: IBGE, 2017 Elaboration: Ex Ante Economic Consulting
Graph 1.2
Distribution of population by household and gender, 2016
Source: IBGE, 2017 Elaboration: Ex Ante Economic Consulting
In 2016, 24.5% of Brazilian women lived in state capitals and in the Federal District. This was equivalent to a population of 25.9 million people.
Considering the inhabitants of other municipalities in the metropolitan regions, it is estimated that 43.1 million women (40.7% of the total) live in metropolitan areas of Brazil. The other 62.3 million women (59.3% of the total) lived in the countryside municipalities of the states.
Graph 1.3
Place of household, female population, 2016

Source: IBGE, 2017 (*) Except the capital. Elaboration: Ex Ante Economic Consulting
According to IBGE estimates, the Southeast region of Brazil had about 44.8 million women in 2016, corresponding to 42.3% of the total of women in the country. In this region, there were the states with the three largest female populations in the country: São Paulo, with 23.3 million women, Minas Gerais, with 10.8 million and Rio de Janeiro, with 8.7 million. Considering only urban areas, the female population of the Southeast of Brazil reached almost 42 million people, equivalent to 45.8% of the total of women in the country living in urban areas. Considering only the rural areas, the female population of the Southeast of Brazil totaled only 2.8 million women, equivalent to only 19.5% of the national total living in rural areas.
The region with the second largest female population was the Northeast, with 29.4 million women, or 27.8% of the total. In this region, the predominance on urban and rural areas are reversed. Northeastern women living in urban areas totaled 22.4 million people, which accounted for only 24.4% of the total number of women living in urban areas in the country. Those living in rural areas reached a contingent of 7 million people, corresponding to almost half of the rural female population of the country.
The South, North and Midwest regions accounted for 14.3%, 8.2% and 7.5% of the country's female population in 2016 respectively. The predominance of urban female population was relatively higher in the Midwest and Southern regions. In the North, the weight of urban female population was lower in relative terms.
The participation of women in the total population of Brazilian states fluctuated a little: Paraiba had the greatest participation of women in the population (52.8%) and Rondonia the smallest participation (49.9%). In rural areas, however, there was a greater variation in the rates of participation of women in populations. While in Amazonas, only 44.4% of the rural population were was comprised of women, in the state of Paraiba, that percentage reached 50% in 2016.
Age Distribution
Of the 105.9 million Brazilian women, 20.5 million were children and young people up to 14 years of age, corresponding to 19.4% of the total women in 2016. Women aged 15 to 29 years old accounted for 22.8% of the female population. The great concentration occurred in the group of women aged between 30 and 59 years old, which had a population of 44.6 million people (42.1% of the total). Women over the age of 60 represented 15.6% of the country's female population in 2016.
Map 1.1
Spatial distribution of women, in millions of people, 2016
Source: IBGE, 2017. Elaboration: Ex Ante Consultoria Econômica.
It is important to note that the Brazilian female population was concentrated in older age groups than the male population. In 2016, the male population exceeded the female population up to the age group of 15 to 19 years old. From this range, women represent more than 50% of the population, reaching a share of more than 70% in ages over 95 years old.
Graph 1.4
Age pyramid by gender, 2016
Source: IBGE, 2017 Elaboration: Ex Ante Economic Consulting
Brazilian women had a greater longevity than men and, consequently, a higher average age. In 2016, according to PNADC data, the average age of the female population was 35.7 years old, while the average age of the male population was only 33.6 years old. This indicates that women were, on average, 2.1 years older than Brazilian men.
Women living in urban areas had a higher average age than women in rural areas: 36.1 years old versus 33.4 years old in 2016. In the capitals of the Brazilian states, the average age was even higher (37.3 years old).
Table 1.1
Average age by gender and area, in years, 2016
| Women | Men | Average | |
|---|---|---|---|
| Urban | 36.1 | 33.7 | 34.9 |
| Rural | 33.4 | 33.3 | 33.4 |
| Average | 35.7 | 33.6 | 34.7 |
Source: IBGE, 2017 Elaboration: Ex Ante Economic Consulting
Education
According to data from the PNADC of 2016, 91.5 million declared that they could read and write, which represented 91.9% of the 99.6 million female respondents. Despite this, the advancement of this population in terms of education was still relatively slow. By 2016, only 55.6 million women had completed elementary education, equivalent to 55.9% of the total of 99.6 million women aged 5 years or older in the country. The percentage of women who completed high school was even lower, at 40.9%. The female population who completed higher education was 12.6 million in 2016, corresponding to 12.6% of the female population that responded to the survey.
Graph 1.5
Level of instruction by gender, in (%) of the population, 2016
Source: IBGE, 2017 Elaboration: Ex Ante Economic Consulting
In comparison with men, women had higher educational levels. The number of illiterate men was 8.4 million whereas only 8.1 million women reported not being able to read and write. The number of men who completed elementary school was 48.2 million, while among women there were 55.6 million. The difference in education increased even more when the numbers of people who achieved high school diplomas were compared: 33.3 million men versus 40.7 million women. The number of women completing higher education (12.6 million) is also higher than the number of men with this degree (8.8 million).
This difference between genders is associated with the profile of the generations.
Looking only at the young population aged 5 to 19, it can be seen that the percentages of men and women attending school in 2016 were close, being slightly higher in the male population: 66.4% (men) versus 65.1 % (women). For people at 60 years of age or older, the participation of individuals without full elementary school in the total population of men and women was very close. The same occurred when the frequencies of men without a high school diploma are compared to that of women without it.
Therefore, the gender distinction between men and women is concentrated in the 20-59 age groups, that is, in the population that was born between 1957 and 1996 and was adult in 2016. For the population aged 20-29, for example, the relative frequency of men without full high school education was 39.2% in 2016. In the same year, the relative frequency of women in this condition was only 28.6%, indicating a difference of more than 10 percentage points between the two groups. This indicates that women born between 1987 and 1996 reached higher levels of education.
Data from PNADC indicate that, in 2016, 25.4 million women were attending some regular course. Considering the total number of women of school age (over 5 years old), the enrollment rate reached 25.5%. That is to say that one in four women was studying at the time of the survey. In men the enrollment rate was 27.2%, almost two percentage points above that of women.
Race
In 2016, about 8.5 million Brazilian women declared themselves black, which corresponded to 8% of the Brazilian female population. 48.7 million Brazilians declared themselves to be multiracial (46.0% of the total) and 47.8 million women declared themselves white (45.1% of the total). The female self-declared of Asian descent population reached 710,700 people (0.7% of the total) and the self-declared indigenous population, 272,100 people (0.3% of the total).
It is important to note that male self-reported black and multiracial population is higher than female. In contrast, white self-reported population is lower among men than among women.
Graph 1.6
Population distribution by race, 2016


Source: IBGE, 2017 Elaboration: Ex Ante Economic Consulting
Another important difference in race was the average age of the population groups. The average age of the self-declared multiracial women (33.5 years old) was significantly lower than the average age of the self-declared white (37.6 years old) or black (37.2 years old). The self-reported women of Asian descent had the highest average age among the groups: 44 years of age. Indigenous women were 35.5 years old on average. Something similar happened with the male population, for which the average ages of the self-declared multiracial (31.9 years old) and the indigenous self-declared (31.7 years old) were even lower than those of self-declared white men (35.1 years old) and blacks (34.9 years old).
Graph 1.7
Average age of women, by race, 2016

Source: IBGE, 2017 Elaboration: Ex Ante Economic Consulting
The education of self-declared of Asian descent and white women is significantly higher than that of self-reported black and multiracial women. While illiteracy rates are less than 10% in the first two groups, in the black and multiracial population the rates were 13.2% and 14.4% in 2016.
Among indigenous self-declared women, the illiteracy rate was close to 20%. On the other hand, the frequency of women with complete higher education is significantly higher in the groups of self-declared women of Asian descent (31.5%) and white women (18.6%) than in the self-reported black groups (7.6%) and multiracial group (7.3%).
Graph 1.8
Women's level of education, by race, in (%) of the population, 2016

Source: IBGE, 2017 Elaboration: Ex Ante Economic Consulting
Responsibilities
By 2016, PNADC data indicate that 28.7 million women were responsible for the household, that is, they headed their households. Thus, women headed 41.4% of the households in the country. The average ratio of the number of women in charge of the household to the total number of women reached 27.1% in that year. It is worth mentioning that the rate was higher among self-reported black women (35.1%), women of Asian descent (32.4%) and indigenous women (32.2%). Self-reported white and multiracial women had rates of 26.6% and 26.1%, respectively.
Graph 1.9
Heads of households by gender, (%) of the total

Source: IBGE, 2017 Elaboration: Ex Ante Economic Consulting
Graph 1.10
Women's household head, rate by race, 2016

Source: IBGE, 2017 Elaboration: Ex Ante Economic Consulting
Approximately 30% of women over 15 years of age had children or stepchildren living in their houses.
These women totaled 25.7 million mothers who assisted in the care of 42.4 million children or underage stepchildren. This was equivalent to an average of 1.65 children or stepchildren per mother. In rural areas, this average was even higher: 1.87 children or stepchildren per mother. Adding to the contingent of 5.3 million grandparents who lived with their grandchildren or great-grandchildren, almost 30 million women split their time as students, workers, housewives or retirees with caring for children, step children, grandchildren and great-grandchildren.
Graph 1.11
Frequency of mothers* by race, among women belonging to the poverty group

Source: IBGE, 2017 (*) with minor children Elaboration: Ex Ante Economic Consulting
The PNADC of 2016 registered for the first time the dedication of Brazilians to care for people and domestic work and the time spent in these activities in the population over 5 years old. The data indicate that 28.1% of Brazilian women reported having dedicated themselves to the care of people who lived in the same house as them. The care involved assistance in the health, education, transportation or leisure of children, the elderly, the sick or people with special needs. In addition to the residents, 3.6% of women aged 5 years and over stated that they had dedicated themselves to the care of relatives who lived elsewhere. These rates were significantly higher than men who dedicated time to people care.
Graph 1.12
Dedication to care and housework, women with and without children, in hours / week

Source: IBGE, 2017 Elaboration: Ex Ante Economic Consulting
There was also a high dedication to housework, which involved activities such as: cooking, serving and washing dishes; cleaning or maintenance of clothing and shoes; make small repairs or maintenance of the home, car, appliances or other equipment; cleaning or tidying up the home, garage, yard or garden; taking care of the organization of the home (pay bills, hire services, guide employees, etc.); shopping or searching prices for goods to the home; and taking care of domestic animals. According to the PNADC, 83.3% of Brazilian women over 5 years of age report having engaged in domestic work in their own homes and 2.5% in the homes of relatives. In the male population, these frequencies were much lower: respectively 65.5% and 0.7%.
Table 1.2
Frequency of persons having domestic and people care activities, by gender and location, 2016
| Where | Type of help | Men | Women | Average |
|---|---|---|---|---|
| At home | People care | 19.0% | 28.1% | 23.7% |
| At home | Domestic services | 65.5% | 83.3% | 74.7% |
| In the house of relatives | People care | 1.4% | 3.6% | 2.5% |
| In the house of relatives | People care | 0.7% | 2.5% | 1.6% |
Source: IBGE, 2017 Elaboration: Ex Ante Economic Consulting
It is worth mentioning that the average time spent in personal care and housework performed at home or in relatives' homes was higher among women than among men. On average, women spent 20.0 hours per week on these activities, while men spent only 10.7 hours per week. The greater frequency of women with dedication to these activities and the longer dedication time resulted in a very uneven distribution: 71.5% of the total time devoted to personal care and domestic work performed at home or in the homes of relatives was incumbent on Brazilian women and only 28.5% on men.
Another finding revealed by the IBGE survey was the larger overload on mothers and grandmothers. Considering only mothers with underage children, the time spent on these activities reached 24.7 hours a week on average. Younger mothers, who had children on average also younger, spent more time caring for people and domestic activities – in the case of mothers aged 15 to 19 years, the time devoted to care and housework reached 28.8 hours a week on average. Women over 14 years of age, but without underage children, on the other hand, devoted less time: 14.9 hours a week on average.
Job Market
In addition to heads of household, mothers or grandmothers who spend hours caring for family members, women have been highly engaged in the labor market. According to PNADC data for 2016, there were 86.9 million Brazilian women over 14 years of age. Of these women, 45.2 million were part of the labor force (52.0% of the total). Of this group, 86.9%, or 39.3 million women, were employed and 13.1%, or 5.9 million women, were unemployed. Of the 41.7 million women out of the workforce, it is worth noting that there were 4 million people who could potentially belong to the workforce. This means that the female labor force had a potential to increase by almost 9% without the need for population growth.
Table 1.3
People in the workforce, by gender and situation, 2016
| Men | Woman | Average | ||
|---|---|---|---|---|
| In the workforce | Occupied | 51,937,457 | 39,254,014 | 91,191,470 |
| In the workforce | Unoccupied | 5,924,295 | 5,930,808 | 11,855,103 |
| In the workforce | Subtotal | 57,861,751 | 45,184,821 | 103,046,573 |
| Out of the workforce | With Potential | 2,427,068 | 4,001,462 | 6,428,531 |
| Out of the workforce | Without Potential | 19,511,508 | 37,725,409 | 57,236,917 |
| Out of the workforce | Subtotal | 21,398,576 | 41,726,872 | 63,665,448 |
| Total | 79,800,328 | 86,911,693 | 166,712,021 |
Source: IBGE, 2017 Elaboration: Ex Ante Economic Consulting
The situation of men in the labor market was very different. Of the men over 14 years of age in 2016, 72.5% belonged to the labor force, which equated to 57.9 million people. Of this group, 51.9 million men were employed, indicating an unemployment rate of only 10.2%; a lower value, therefore, than that of the unemployment rate in the female population (13.1%). The number of men out of the workforce, but with the potential to work, was 2.4 million, a figure lower than that of women.
These facts explain why women accounted for only 43.8% of the total workforce in the country and 43.0% of employed persons (men and women). It also justifies the fact that there was a tendency for women to increase their participation in the Brazilian labor force: 62.2% of the workforce that could be part of the labor force in a short period of time was female.
From the regional point of view, it should be noted that in the Midwest, South and Southeast of the country, the percentage of women belonging to the labor force varied between 55.0% and 56.0% of the female populations in each region. In the Northeast and North regions, these shares were smaller: 44.7% and 49.4% of the women. A similar situation occurred when the occupation rate was observed: it was higher in the South (91.1%), Midwest (88.4%) and Southeast (86.5%) regions.
Map 1.2
Regional distribution of employed women, in millions of people, 2016

Source: IBGE, 2017 Elaboration: Ex Ante Economic Consulting
Of the women employed in the Brazilian economy in 2016, 43.1% (16.9 million) were employed in private sector companies, 19.0% (7.5 million) were self-employed and 16.4% (6.4 million) were government employees (including administration, health and education). There were only 1.3 million entrepreneur women (3.3% of all women in the workforce), which represented only 30% of all employers in the country (men or women).
Graph 1.13
Distribution of employed women by employment situation, 2016

Source: IBGE, 2017 Elaboration: Ex Ante Economic Consulting
It is worth mentioning the high participation of domestic workers and auxiliary family workers in the female labor force. In 2016, 5.7 million women were houseworkers (14.5% of the total employed women) and 1.4 million women worked as auxiliary family workers (3.6% of all employed women). Such careers in male labor force were significantly lower, 0.9% and 1.5%, respectively.
Considering the distribution of women employed by the economic sector, there is a strong concentration in the activities of private sector (25.2%), educational and healthcare (20.4%), commercial (18.9%) and industrial (10.1%). Considering participation of men and women in these sectors, women's participation was relatively high: private services (41.8%), education and healthcare (76.1%), commercial services (42.2%) and industrial (34.5%). In domestic services, women's participation in the total workforce exceeded 90% in 2016.
Graph 1.14
Distribution of employed women by sector of economic activity, 2016

Source: IBGE, 2017 Elaboration: Ex Ante Economic Consulting
According to PNADC data for 2016, most women worked with a journey of between 40 and 44 hours a week. There was also a high proportion (28.3% of all women) who worked in shorter days, from 15 to 39 hours a week. On average, women ended up having a shorter average working day compared to men, which was in part due to greater dedication to domestic activities and caring for people.
In 2016, the average remuneration of women's work was R$ 1,826.35. Women who worked more than 49 hours a week achieved a higher remuneration of R$ 3,048.41. In sectoral terms, the highest average remuneration was obtained in construction companies (R$ 3,521.64), where there is a small number of women employed, but with a higher predominance of positions with a high technical level (engineering and architecture). In the public service, a segment in which the participation of women in the workforce is high, the remuneration of women was R$ 3,452.91 and in education and health activities, R$ 2,576.03.
It should be noted that, for practically all work segments and working hours, women received lower pays than male workers. On average, the difference was 22.9% less for women, suggesting the occurrence of strong gender inequality in the labor market. This point will be discussed in more detail in Chapter 4 of the report.
Graph 1.15
Distribution of employed persons by weekly workload, men and women, 2016

Source: IBGE, 2017 Elaboration: Ex Ante Economic Consulting
Poverty
Gender inequality is added to other characteristics of the country in the formation of a society with high levels of poverty. In order to estimate the number and profile of poor women, the criterion of relative social class was adopted, which is used in much of the literature on the subject and which guides social policies in a considerable number of countries. This criterion establishes classes based on the per capita income of the households. Five economic classes are considered, each housing 20% of the Brazilian families. In the first class are the poorest families and people who, in the case of Brazil, had a per capita household income of less than R$ 325.00 per month in 2016. This was equivalent to an income of R$ 10.68 per person per day (this monthly amount was higher than the extreme poverty line suggested by the World Bank, which was R$ 133.70 per person, but slightly lower than the broader poverty line definition, also suggested by the World Bank, and which was R$ 387 per person in 2016.)
Map 1.3
Number of women below the poverty line in millions of people, 2016

Source: IBGE,2017. Elaboration: Ex Ante Economic Consulting
Based on this criterion, it is estimated that there were 21.325 million women and 20.028 million men below poverty, totaling 40.353 million poor by 2016. This means that the participation of women in the Brazilian poor group was greater than that of men: 51,6% versus 48.4%, respectively. Nearly 60% of the female population in poverty was under 29 years of age, indicating a higher incidence among Brazilian girls. In fact, about 34% of all women under 14 years of age and 30% of women aged 15 to 19 years were from poor families.
Graph 1.16
Self-reported race distribution of women below the poverty line, 2016
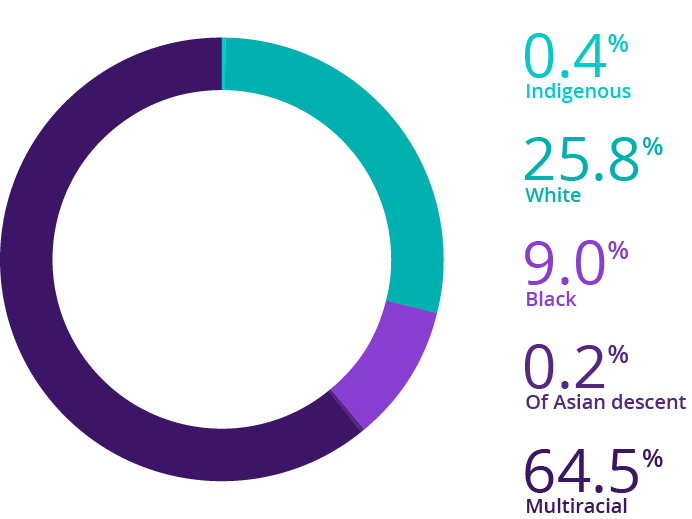
Source: IBGE, 2017 Elaboration: Ex Ante Economic Consulting
The incidence of women in poverty is particularly high in the populations of self-reported black, multiracial and indigenous women. In these groups, there were almost 3/4 of the Brazilians in poverty: 15.766 million out of a total of 21.325 million women (73.9%). Among black, multiracial and indigenous women in poverty, the largest share (44.3%) was young people under 30 years of age. The incidence of poverty among younger age groups confirms this trend: 36.4% of young black girls, 42.0% of young multiracial girls and 48.5% of young indigenous girls lived in households below the poverty line in 2016.